When I first started out, I was desperate to consume detailed display ad metrics from other niche sites.
What could my tiny blog earn? What was even possible?
But for obvious competition reasons, most site owners (including me) who talk about earnings tend to keep things pretty high-level, blinded and tight-lipped.
Not today.
In this week’s newsletter, I decided to share some completely unblinded revenue metrics for my first project, The Flexible Worker.
It’s important to keep in mind that display ad earnings are impacted by a ton of different variables.
The niche your site is in, amount of traffic your receiving and from where, number of ads shown during a session, time of year…the list goes on. They all play a role.
Over the three month period from August 2022 to October 2022, Ezoic was turned on for the first time. During this stretch, the site earned a total of $5,460 in ad revenue.
Here are some additional site metrics and points of interest during this targeted time frame:
- Niche: Tech troubleshooting
- Total No. of Posts Published: 142 to 161
- Age of Site: 10 to 12 months
- Total Pageviews: 165,816
- Avg Time on Page: 08:39
- Pageviews by Device: 55% mobile, 45% desktop
- Users by Country: US (52.8%), UK (5.8%), Canada (5.0%) and Australia (3.09%)
For all of the stats provided below, I filtered for posts that had at least 100 pageviews to help eliminate bogus ePMV data.
Ok. Let’s dive in…
Niche Site Display Ad Revenue Breakdown
1.) The highest earning post by total revenue over this time period was a troubleshooting guide for Frontier routers. The article accumulated 11,628 pageviews and earned a total of $360. Funnily enough, the original idea for this post came when I was staying at my father-in-law’s house in Connecticut. I was struggling to connect to his Frontier Wi-Fi and the help guides available at the time were brutal. When my wife and I visited him again a few months later it was pretty cool to show him I was ranking #1 for it.
2.) The highest earning post by ePMV (earnings per thousand visitors)was a Microsoft Team’s post targeting the keyword “Teams status stuck on away”. The article amassed just 486 pageviews with an ePMV of $89.15. This post would later fall out of the rankings and I ultimately made the decision to unpublish it as part of a content pruning effort.
3.) The second highest earning post by ePMV targeted the keyword “Rollo printer not printing” and had an ePMV of $83.84.
4.) The worst performing post by ePMV targeted the keyword “AOC monitor flickering“. The article pulled in 1963 pageviews with an ePMV of $16.88.
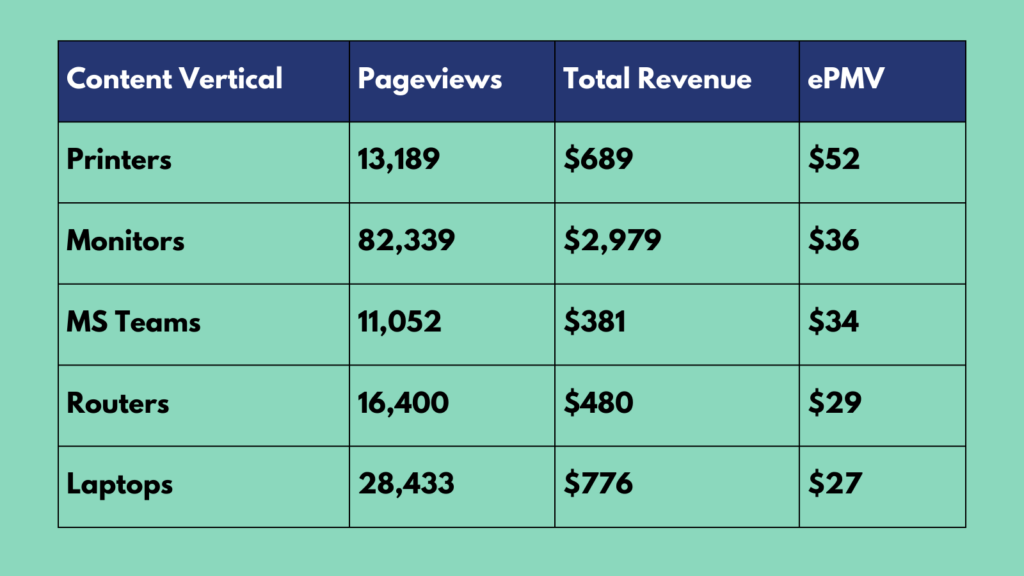
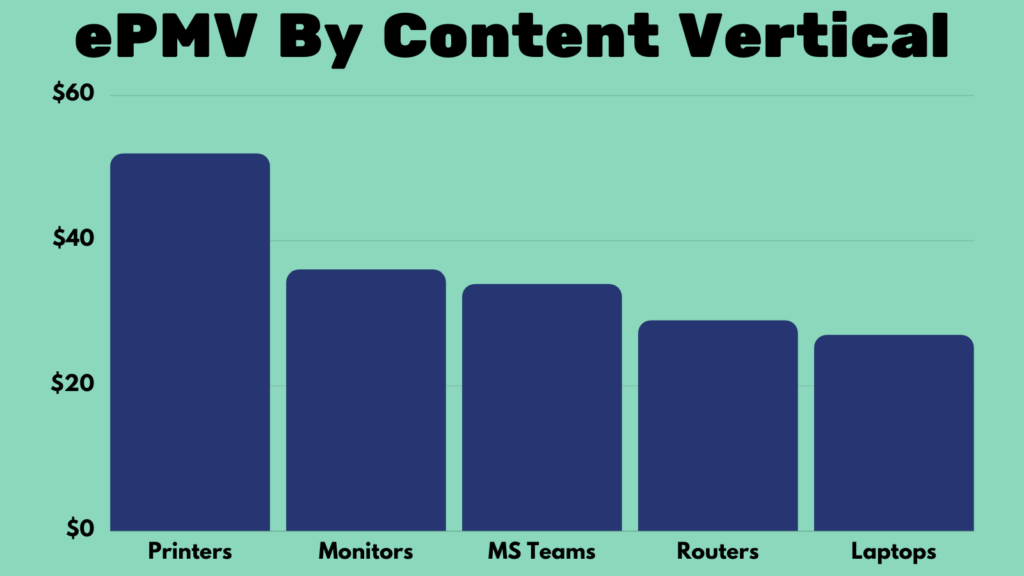
5.) At the time, the content on my site that was consistently ranking fell into one of the following five content buckets: printers, monitors, MS Teams, routers or laptops. The highest earning content vertical by total revenue was monitors, earning a total of $2,979. On the other hand, the highest earning content vertical by ePMV was printers, coming in at an average ePMV of $52.
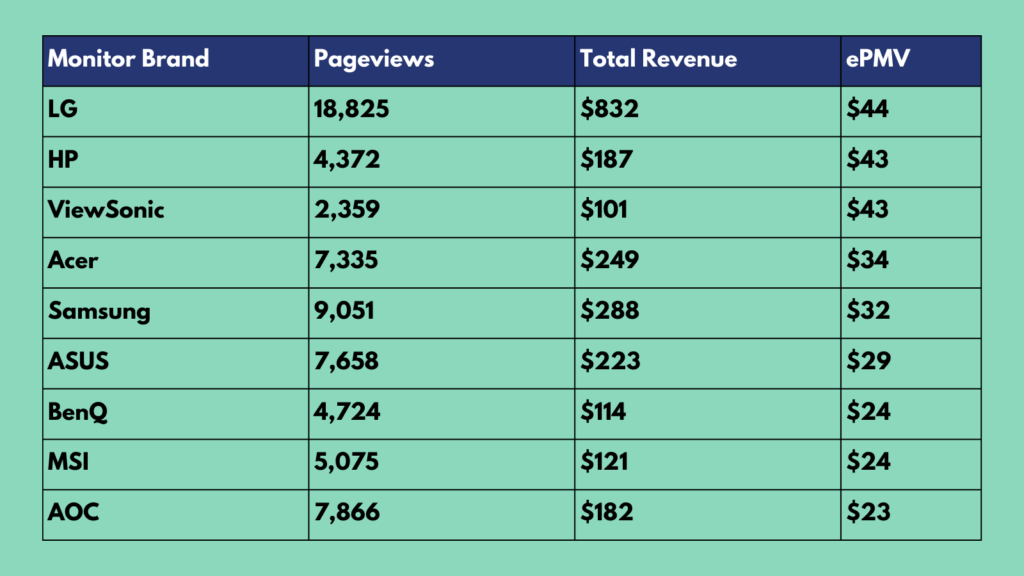
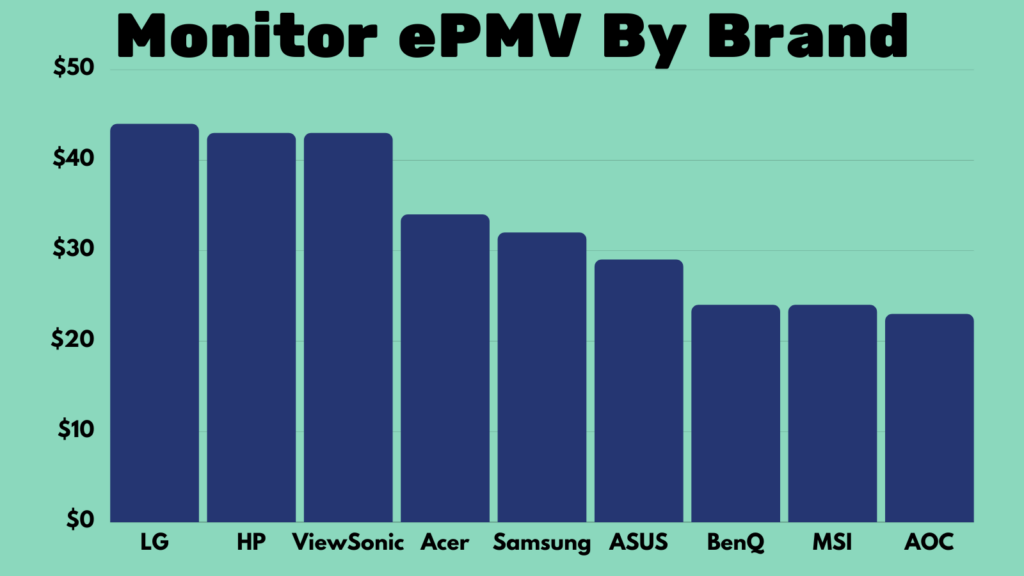
6.) There were about 40 different articles covering various monitor keywords, pulling a grand total of 67,265 pageviews. What’s interesting is back then, I was still doing quite a bit of Brand Swapping. This means that for the vast majority of these posts, the only thing that truly varied was the brand of monitor. For example, if I had a post targeting the keyword “LG monitor flickering”, I would also have a post targeting “HP monitor flickering”, “Acer monitor flickering”, and so on. The content of these articles was mostly the same. So in this sense, the content was a controlled variable allowing an interesting opportunity to more meaningfully compare brand ePMVs. Ultimately, LG monitor content had the highest average ePMV at $44, while AOC monitor content had the lowest average ePMV at $23.
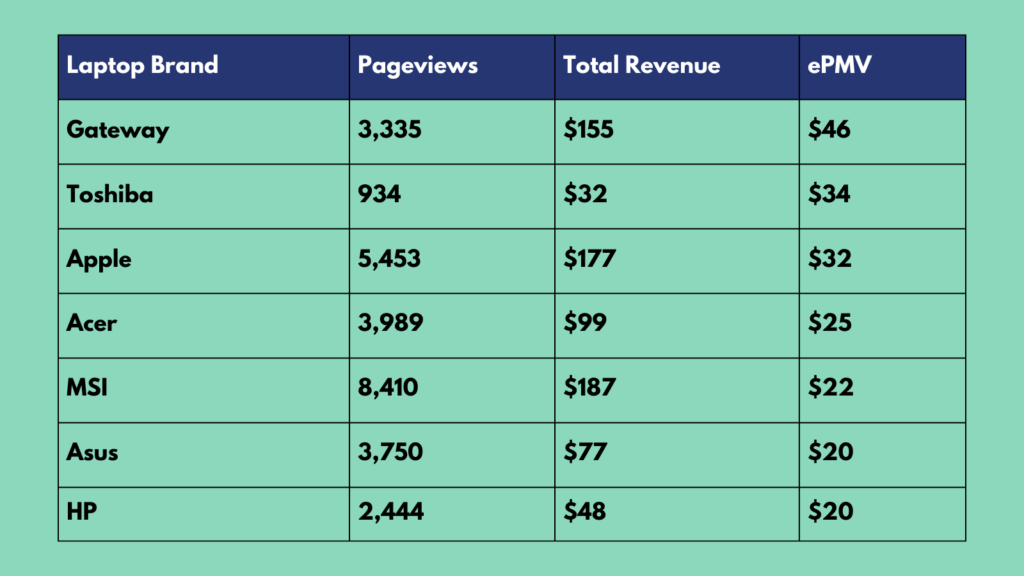
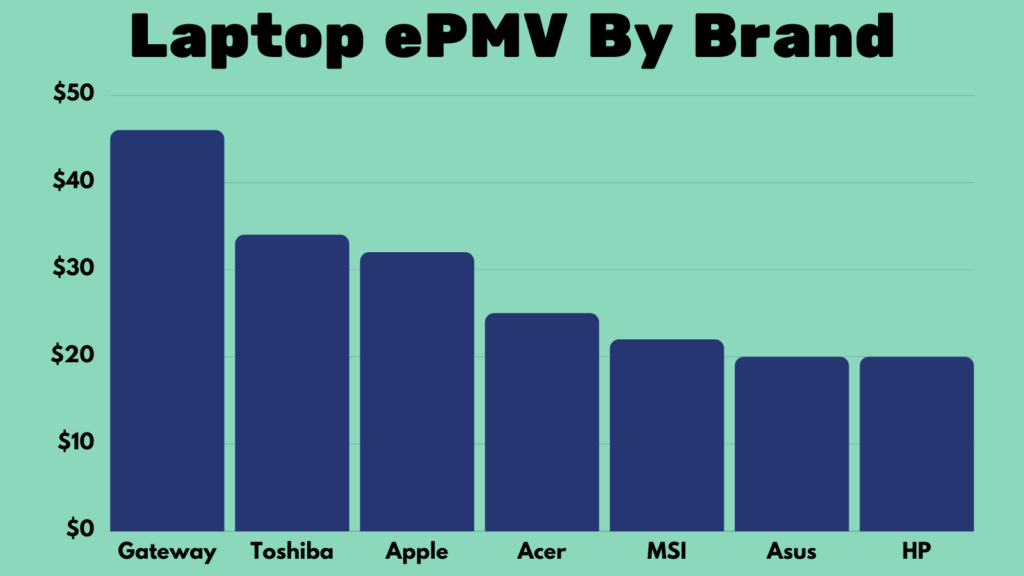
7.) I remember I didn’t have a ton of laptop content during this stretch, but the category was just starting to get picked up by Google and traffic was ramping up nicely. After doing the same data segmentation by brand as before, Gateway laptop content had the highest average ePMV at $46, while HP laptop content had the lowest average ePMV at $20.
The data is interesting, sure. But how is it useful?
The purpose of this type of review was all about informing my content strategy moving forward and maximizing the return on my time.
Google loved monitor content on my site. It was where most of my pageviews and revenue were coming from. And when somethings working, you double down.
I had enough data at this point to justify exhausting every monitor keyword I could find specifically associated with LG, HP and ViewSonic.
But printer content was a vertical I hadn’t put much effort into and it was crushing in terms of ePMVs. The category deserved far more of my attention than it was getting.
It was early days on the laptop front, but Gateway was about to get SEMrush’d to death.
And in order for me to get excited about pursuing any MSI, ASUS or HP laptop keywords, they would need to have at least twice the traffic of a comparable Gateway laptop keyword. Otherwise it wouldn’t move the needle.
So that’s it. Nothing fancy. Just a data driven approach I was using to more strategically plan my content.
That is, until it all went to sh*t. But that story’s already been told.
Tonight my wife and I are seeing The Revivalists. First live show in way to0 long.
JAZZED.
Have a weekend. ✌
-Keith

Niche Twins newsletter sent weekly on Fridays at 8:30 AM ET


